Marketing can be a tricky catch-all term that often feels as ambiguous as machine learning or artificial intelligence for most businesses. Sure, marketing firms offer specialized services that come with their own proprietary analytics for measurement, but for most businesses, the process feels like a black hole of hope as they wait for a tangible return on investment.
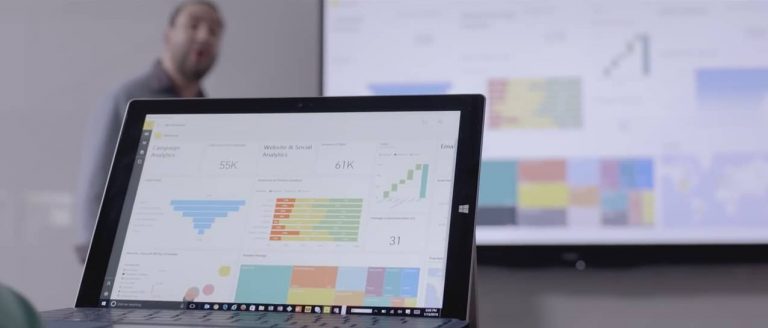
Fortunately, Microsoft’s Power BI can be used as an in-house solution to keep marketing firms honest and with the company’s recent announcement of support for campaign and brand management for Facebook Pages, it’s become even easier.
That’s right, Power BI can now be used to turn your company’s Facebook Page into a legitimate ROI key point of interest by not only measuring and identifying negative posts, comments, key trends, user sentiment, but turning that data into an easy to read visual report.
Making use of Microsoft Research technologies and Azure, users can measure the difference between multiple Facebook campaigns and pages, 90 days worth of post and comments for month over month changes and pre-made template for quick access.
Here are some of the items users can measure when using the Facebook additions:
Campaign/Brand Management for Facebook:
- Get started quickly with pre-built data models for social analytics reporting
- Use an intuitive wizard based UI to define which pages you wish to follow
- Leverage sophisticated visualizations such as the network graph created by Microsoft Research
- Go back in history to do trend analysis to see your growth
With the support going live for users as early as today, Microsoft is wasting no time in offering its partners some spotlight as they look to help users deploy and integrate the new features. Users can visit their Power BI settings to check for the update or read more about it from the Facebook Power BI post here.


